I was listening to an episode of the excellent podcast “Edge Cases” by Andrew Pontious and Wolf Rentzsch titled “Primal Debugging Systems” and they basically said that for all the debugging systems we have these days sometims they will just use NSLog statements to debug (Like an animal) because it was easier than getting information out of lldb. While sometimes an NSLog can be enlightening I have a few quick tips that can have you using lldb like a pro in very little time at all.
Breakpoints
This post is all about the “console” in Xcode. The area of the Xcode interface that pops up when you run your app using the “Run” scheme which outputs your NSLog statements. This is all fine and dandy but when your code hits a breakpoint thats when the magic happens. The console turns into a prompt and is ready to accept commands. Before learning how to use the console you need to know how to set a breakpoint. Luckily its incredibly easy!
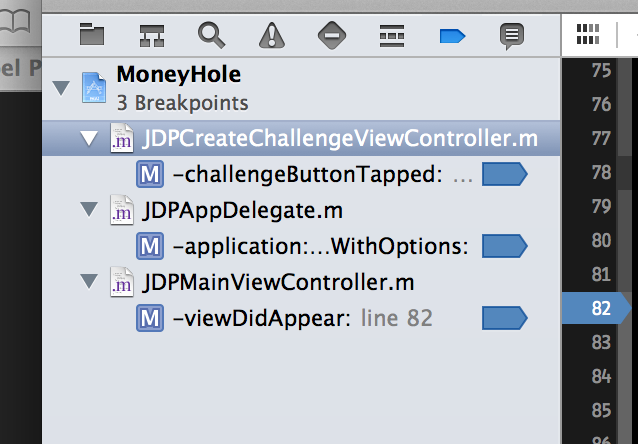
A breakpoint is a place where the debugger will stop the code running when the path of execution gets to that point. From the breakpoint you can then inspect the runtime and even execute the next satements one by one, helping you to understand what is happening in your code. To set a breakpoint you find the line of code you would like the debugger to stop at and click next to that line in the gutter of the xcode editor window.
You can also set breakpoints to stop code based on symbols you dont have in code you can edit, like framework symbols, by setting a symbolic breakpoint in the Xcode breakpoint navigator.
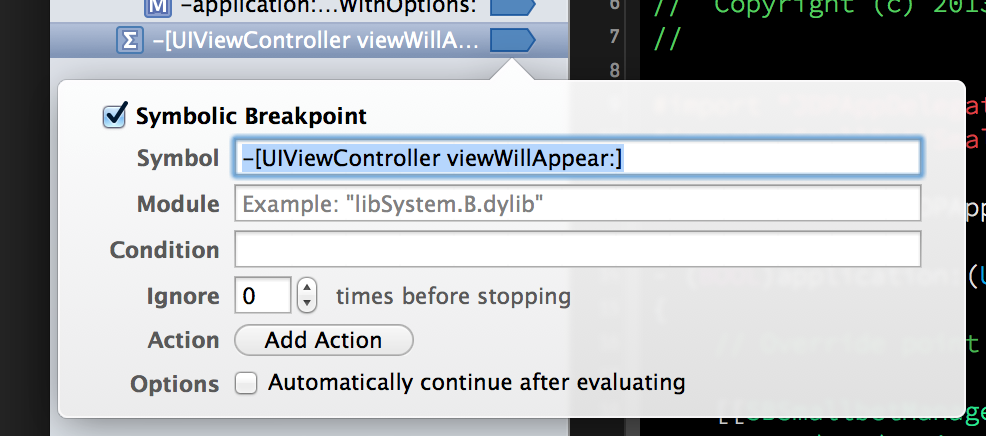
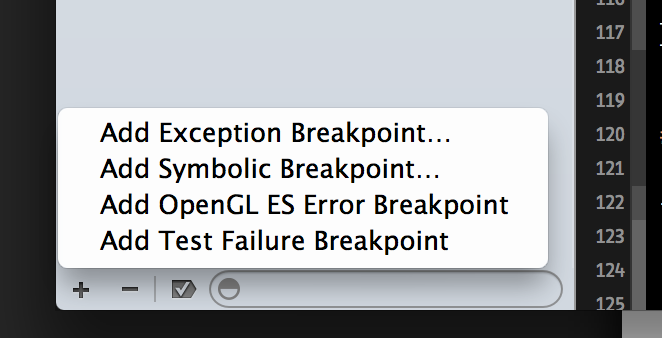
To set a symbolic breakpoint click the plus button in the lower left hand corner and click “Add Symbolic Breakpoint”. You then enter a symbol in the form suggested by the popover:
1 2 3 4 | |
You can also set a breakpont for exceptions, stopping the code at the point the exception is thrown rather than when the app terminates due to the exception being thrown. You do this from the same add button, instead selecting “Add Exception Breakpoint”.
po
So your code hits a breakpoint. What next? Xcode will show you all the variables in scope in the right hand “Variables View” of the debugger pane that pops up from the bottom. In Xcode 5 this view has gotten some really impressive quicklook features but thats all point and click. I’m here to tell you about some commands that you can run in the debugger area. If your code is stopped at a breakpoint you will get the lldb prompt:
1
| |
Rather unassuming. The first command we will try is po. po prints out objective-c objects. Well technically it prints out the result of the -(NSString*)description method defined on NSObject. How useful that information is is up to the developer of the class you are printing. You can print any variables in scope by typing po <variablename>
Great! Most Apple classes have some great descriptions. You can also print the result of methods on your classes if those methods return Objective-C Objects. The debugger will call -(NSString *)description on the results of that method and print that. Example:
1 2 3 | |
Not the most useful result. Lets chain some messages together and see what happens:
1 2 3 | |
Excellent! We’ve printed the description of the main window. Heres a cool snippet that can help you debug your view heierarchy from anywhere you break in your app:
1 2 3 4 5 6 7 8 9 10 11 12 13 | |
Printing Pointers
So if we look at the last example, what if I want to print information about the layer of the window? I could totally do this:
1
| |
OR I could take the pointer referenced in the previous printout and po that instead:
1 2 3 | |
You can even send messages to the object at that pointer like you would a named variable:
1 2 3 | |
You can also even aritrarily pause the execution of your app using the pause button (where the continue button is when your app hits a breakpoint) and po that variable, or some property of it without even needing a breakpoint! Just remember that pointers will probably change from run to run of your app.
Rinse and Repeat
Pretty short section but its worth mentioning that like in a terminal, hitting the up arrow will cycle through your debugger command history. That is all!
Printing Core Foundation Things
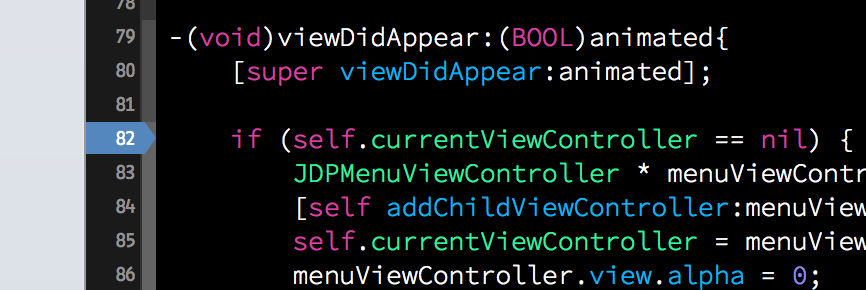
So this is all great until you want to print a CGRect, CGPoint, or even a CGAffineTransform. In fact any of the C-struct style objective-c things we pass around can also be printed out by the debugger really easily. The long command is print but you only need to type p. This time, however you need to tell the debugger what kind of struct you are expecting to get a decent output. Its easier to demo this feature than to explain it so I put a breakpoint inside -(void)viewDidAppear:(BOOL)animated of a UIViewController. Lets see what debugger magic I can work:
1 2 3 4 5 6 7 8 9 10 11 12 13 14 15 | |
Easy to use and awesome.
Hopefully these simple tips can help make your life debugging easier!